

We know how important page speed is to Google, but why is that, exactly? With increasing benefits to SEO, UX, and customer loyalty that inevitably translates to revenue, there are more reasons than ever to both focus on site speed and become adept at communicating its value to devs and stakeholders. In today’s Whiteboard Friday, Sam Marsden takes us point-by-point through how Google understands speed metrics, the best ways to access and visualize that data, and why it all matters.
Click on the whiteboard image above to open a high-resolution version in a new tab!
Video Transcription
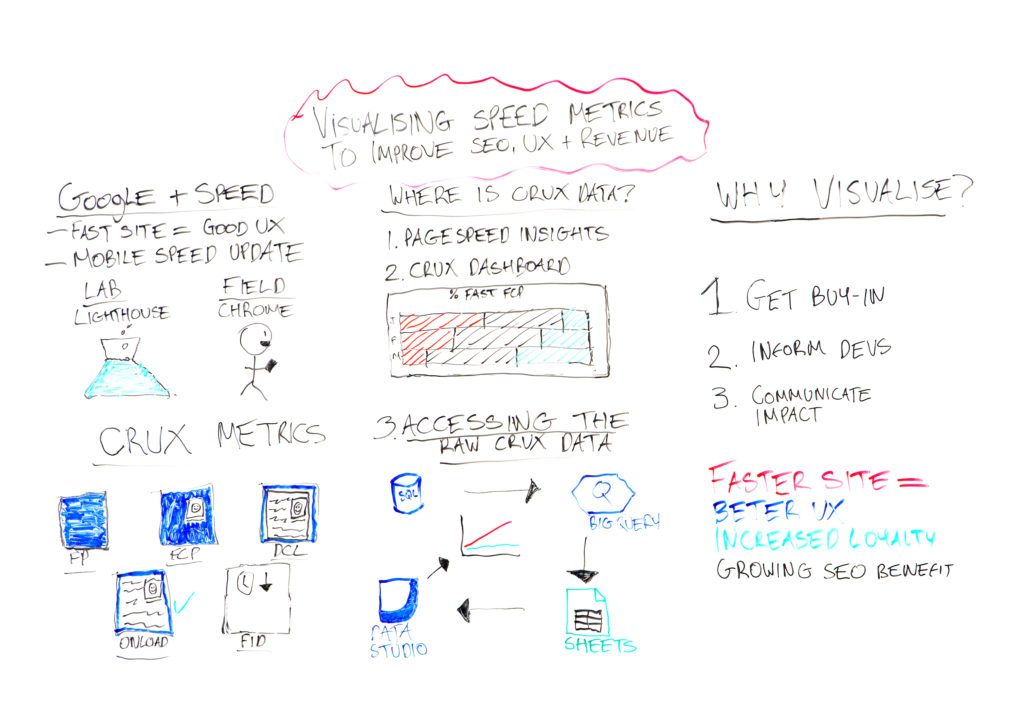
Hi, Moz fans, and welcome to another Whiteboard Friday. My name is Sam Marsden, and I work as an SEO at web crawling platform DeepCrawl. Today we’re going to be talking about how Google understands speed and also how we can visualize some of the performance metrics that they provide to benefit things like SEO, to improve user experience, and to ultimately generate more revenue from your site.
Google & speed
Let’s start by taking a look at how Google actually understands speed. We all know that a faster site generally results in a better user experience. But Google hasn’t actually directly been incorporating that into their algorithms until recently. It wasn’t until the mobile speed update, back in July, that Google really started looking at speed. Now it’s likely only a secondary ranking signal now, because relevance is always going to be much more important than how quickly the page actually loads.
But the interesting thing with this update was that Google has actually confirmed some of the details about how they understand speed. We know that it’s a mix of lab and field data. They’re bringing in lab data from Lighthouse, from the Chrome dev tools and mixing that with data from anonymized Chrome users. So this is available in the Chrome User Experience Report, otherwise known as CrUX.
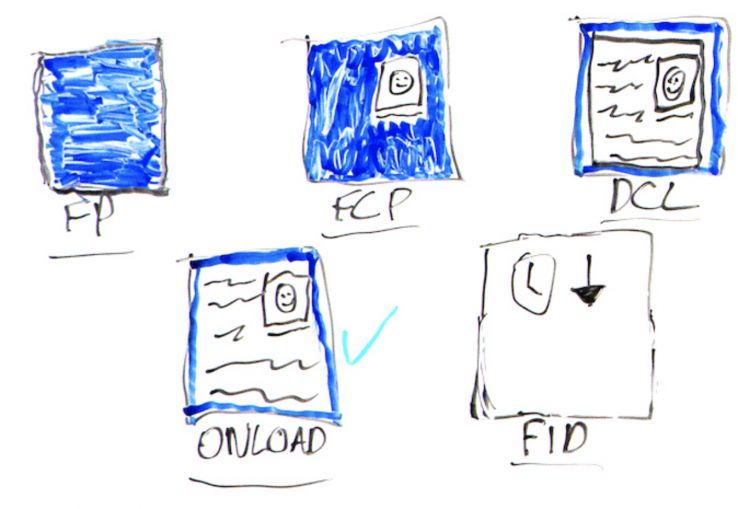
CrUX metrics
Now this is a publicly available database, and it includes five different metrics. You’ve got first paint, which is when anything loads on the page. You’ve then got first contentful paint, which is when some text or an image loads. Then you’ve DOM content loaded, which is, as the name suggests, once the DOM is loaded. You’ve also got onload, which is when any additional scripts have loaded. That’s kind of like the full page load. The fifth and final metric is first input delay, and that’s the time between when a user interacts with your site to when the server actually responds to that.
These are the metrics that make up the CrUX database, and you can actually access this CrUX data in a number of different ways.