
Your organic result game is on point, but you’ve been hearing a lot of chatter about SERP features and are curious if they can help grow your site’s visibility — how do you find out? Our SERP Featuresdashboard will be your one-stop shop for everything feature-related.
If it’s the features in your space that you’re after, you’ll have ’em. The number of keywords producing each feature? You’ll have that, too. The share of voice they’re driving and how much you’re owning? Of course, and more.
Here’s a step-by-step guide on how you can use the dashboard to suss out a SERP feature strategy that’s right for your site.
Establish viable sites and segments
For context, let’s say that we’re working for a large supermarket chain with locations across the globe. Once in the dashboard, we’ll immediately look to the Overview module, which will give us a strong indication of whether a SERP feature strategy is viable for any of our keyword segments. We may just find that organic is the road best travelled.
Clicking through our segments, we stumble across one that’s driving a huge amount of share of voice — an estimated 309.8 million views, which is actually up by 33.4 million over the 30-day average.
At this point, regardless of what the deal is with SERP features, we know that we’re looking at a powerful set of keywords. But, because we’re on a mission, we need to know how much of that share of voice is compliments of SERP features.
Since the green section of the chart represents organic share of voice and the grey represents SERP feature share of voice, right away we can see that features are creating a huge amount of visibility. Surprisingly, even more than regular ol’ organic results.
By hovering over each segment of the chart, we can see their exact breakdowns. SERP features are driving a whopping 188.2 million eyeballs, up by 18 million over the 30-day average, while organic results are driving only 121.6 million, having also gained share of voice along the way.
We’re confident that a SERP feature strategy is worth exploring for this segment.
Get a lay of the SERP feature landscape
Next, we want to know what the SERP features appearing in our space are, and whether they make sense for us to tackle.
As a supermarket chain, not only do we sell fresh eats from our brick-and-mortar stores, but our site also has a regularly updated blog with delectable recipes, so we’ve got a few SERP features already in mind (can anyone say places and recipe results?).
But, if for some strange reason our SERPs are full of flights and jobs, maybe we’ll move onto a segment that we can have more impact on, and check in on this one another time.
Daily snapshot
To see what we’re working with, we head to the [Current Day] SERP Features chart, make sure every feature is enabled in the legend, and select SoV: Total from the dropdown, which will show us the total share of voice generated by each feature appearing on our SERPs.
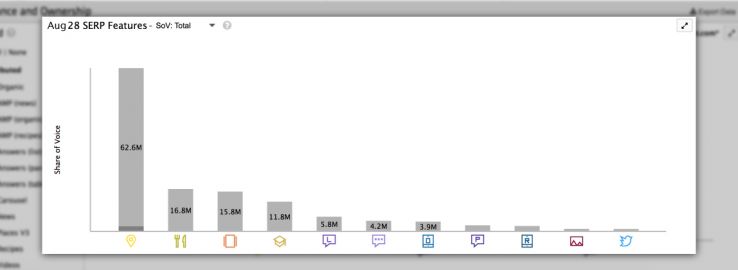
Right away we know that the top two share of voice earners are directly in our wheelhouse: places and recipe results. What are the odds!
Carousels and knowledge graphs — features that we have little or no control over — might be next on the list, but the ones trailing them aren’t far behind and are winnable. So, we’ll pick our favourite five — places, recipes, list snippets, “People also ask” boxes, and paragraph snippets — to build strategies around, and make sure only they appear on our chart.
Since food and food-related activities tend to be heavy on the visuals, it wouldn’t be wise for us to neglect images and videos entirely, so we’ll also enable them just to creep on. (We’ll think of recipes and AMP recipes as one, and make a mental note to look into an overall AMP strategy at some point.)
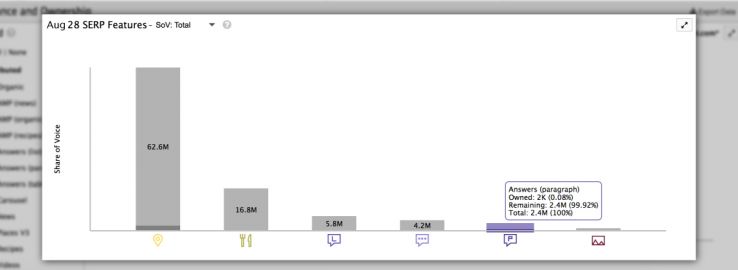
Our [Current Day] SERP Features chart now shows how our chosen features stack up against each other in terms of share of voice. Apparently, videos have such a small impact that they don’t even warrant a bar on the chart.
Over time
But, before we ride off into the sunset with our SERP features just yet, we still need to do a little more research to see whether they’re a long-term relationship option or a mere flash in the pan.
To do this, we look to the SERP Features Over Time chart, take the SoV: Total metric with us, and select a date-range wide enough to give us a good idea of their past behavior. Ideally, we’d love to see that they’re making continual progress.
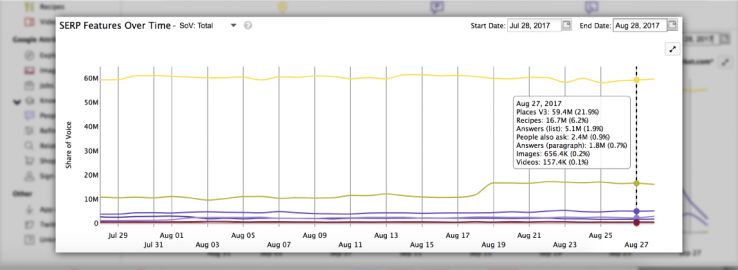
At the very least, they appear to have a pretty stable presence — no questionable dips to be seen — which means that we’ve got ourselves some dependable features. Cool.